XL3DRender is a Microsoft Excel VBA macro created in MS Office 97 which draws animated 3D wire frame graphics using spreadsheet cells as raster pixel array. By making the spreadsheet cells very small and turning off the grid lines, a basic raster display can be produced by changing the background colour of the cells. With a bit of imagination it is possible to use this to generate graphical output, or even draw 3D shapes or animations.
The Idea
In some spare time in the summer of 2002 a work colleague, Christopher Allen was working on the idea of writing a simple game such as Snake to run in Excel. The Snake game had received renewed popularity at the time due to its presence on affordable Nokia mobile phones. I had previously demonstrated a VBA macro of Conway’s Game of Life using the background colour of the spreadsheet cells, however for a game such as Snake we ran into difficulties while trying to get interactive user input to work correctly. We came to the conclusion that VBA wasn’t designed for writing games! Despite this, I had already written the code to draw basic shapes and lines using Bresenham’s line algorithm
Shortly after this, I visited a performance by a traditional travelling theatre. At one point in the performance, a 3D visualisation was projected onto a screen in the middle of the stage from behind. The effect produced a smooth 3D fly through of a wire frame cathedral and town the screen. This visualisation blew my mind since the entire performance was low-tech, no electrical or battery powered appliances were used in the theatre. This ruled out the use of cameras, projectors and all lighting in the theatre was either by means of candle, gas, limelight etc.. The theatre was basically a tent in a field.
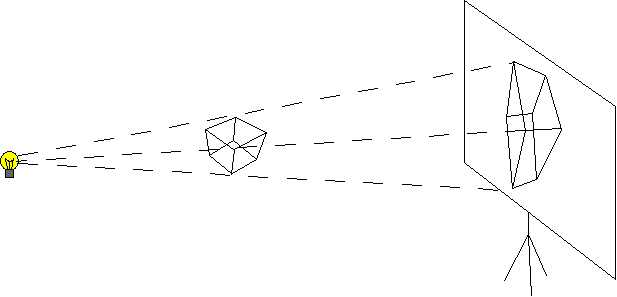
I later discovered that they had produced this effect by using a real wire frame model and a very bright magnesium point light source. The image produced on the screen was simply a shadow image, and the effect of perspective and movement were naturally taken care of by moving the model in front of the light source with steady hands. Words cannot describe how impressive this visualisation was, given that no technology post 1880 was used.
Afterwards, while describing the 3D visualisation effect, and explaining how it worked, we figured that it would theoretically be possible to produce such an image using the VBA drawing functions we had already written in Excel. Why not!
Implementation
By reducing the size of the cells of an Excel spreadsheet to one pixel per cell, and turning the grid lines off, a 2D imaging area can be produced. The background colour of the cells can be changed to change the colour of the pixels.
Line Drawing Algorithm
The de-facto line drawing algorithm for drawing straight lines on a raster display is the Bresenham’s line algorithm. This algorithm was implemented in VBA code, and a VBA function was created which draws a line between two sets of x,y coordinates.
3D Projection
Coordinates in the three dimensional space are projected using basic trigonometry into their relative shadow positions on the 2 dimensional screen. This process is known as 3D Projection. The magnesium light source described above is known as the View Point because it becomes the point at which the projected image is viewed from. This takes a bit of getting your head around, but effectively the light source is the camera. The amount of perspective can be adjusted by moving the view point closer to the object. If the view point is moved so close that it falls inside the object, then a view from inside the object is projected. The distance between the view point and the screen changes the image scaling. Moving the screen closer to the view point makes the image smaller, just as you’d expect from shadow projection. The view point and screen are normally given fixed locations, and the object is moved and rotated to create the effect that the camera is moving. One interesting property of this projection method, which is not possible to achieve using real-world shadow projection, is the ability to have an object, or part of it on the wrong side of the screen. In the real world this would result in poking a hole through the screen and the part of the object that had poked through would not cast a shadow. It is somewhat surprising that the basic trigonometry calculations don’t seem to care which side of the screen the object is on. Objects on the opposite side of the screen to the view point have a greater than 1x magnification so this removes the need to post-scale the rendered image. Since the lines between the points are drawn using a 2D line drawing algorithm, the only points that need to be projected from 3D to 2D are the vertices. This technique provides a significant performance improvement over projecting every point along the lines.
Animation
The animated fly through is achieved by rotating and offsetting the 3D object with respect to the viewpoint and screen. Again, this requires some basic geometry/trigonometry, however only the vertices require rotation and offset. Initially while deriving the formulae for this, an error was made with the sign of the angles. This resulted in a bizarre effect where as shapes were rotated, they fell apart because some vertices were rotating in the opposite directions. This bug took some time to resolve, however once it had been corrected the renderer started to look pretty cool. The only problem at this stage was the amount of time taken to draw the shapes. Due to the slow drawing rate, it wasn’t possible to get any sense of animation because as soon as the line by line rendering of a frame was complete, the display would be cleared in order to begin the rendering of the next frame. This problem was resolved by using a technique known as Double Buffering.
Double Buffering
This method involves using two worksheets, one for drawing and one for display. Since only one sheet can be selected and displayed at any given time, the hidden sheet is used for drawing. As soon as the drawing operation is complete, the hidden worksheet is selected to become the displayed worksheet. This instantaneously displays the next frame in the sequence. The previous frame is simultaneously hidden, and is used for the drawing of the next frame in the sequence. This process ensures that the animated effect is preserved, and the viewer does not see any partially rendered images. This also gives a performance increase because the image being rendered is not being continually refreshed to the screen as each pixel is updated. The screen is only refreshed once when the active worksheet is flipped.
Data Flow
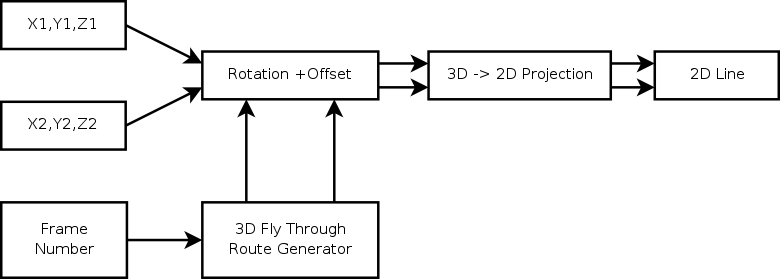
This 3D rendering engine can be summarised with a relatively simple data flow. The data originates from a spreadsheet table, with each row in the table representing a line to be drawn. The line is defined by an X1,Y1,Z1 starting point coordinate, and an X2,Y2,Z2 ending point coordinate. For each 3D coordinate, the coordinates are first rotated and offset, then projected into 2D, then a line is drawn between the start and end coordinates using the 2D line drawing algorithm. The rotation and offset are determined by arbitrary formulae that produce the rotation angles and offsets, and depends only on the frame number. This formula defines the animated rotation and panning effects. It could equally be replaced with a look-up table on a separate worksheet to give more flexibility over the rendered animation.
Download
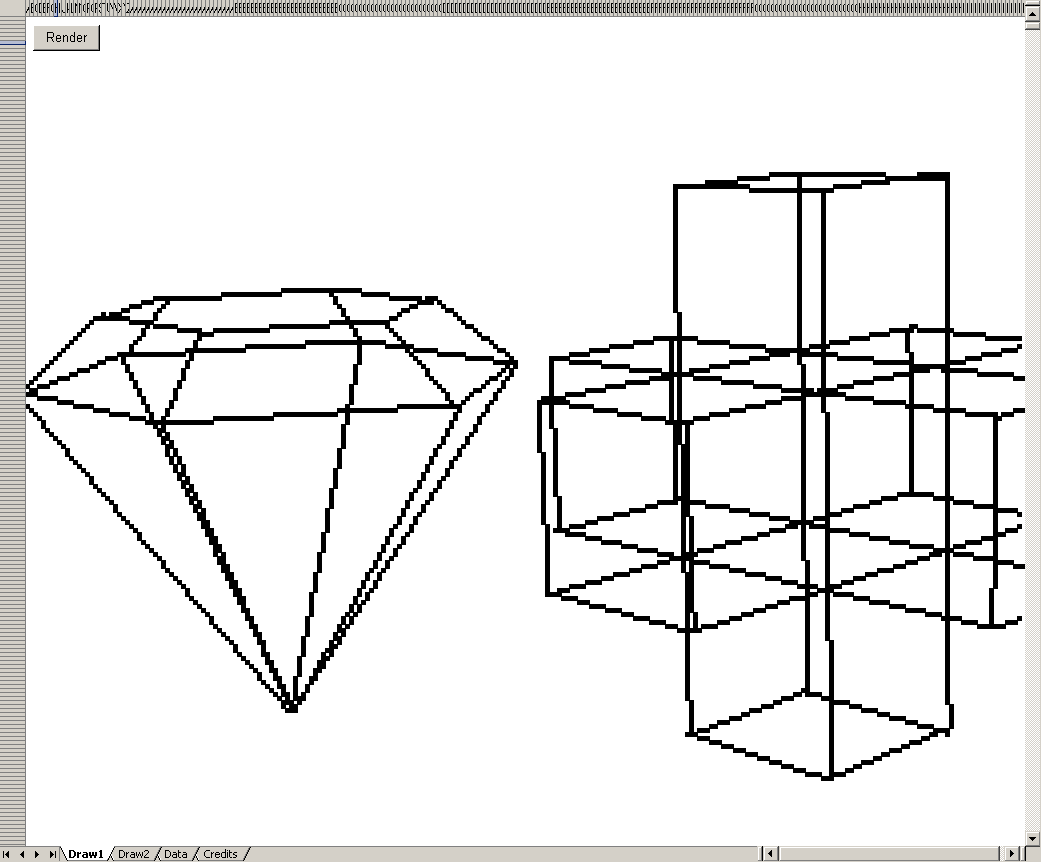
To download XL3DRender, follow the links below. Additional objects can be added by simply pasting them into the spreadsheet. Feel free to experiment, and create 3D shapes of your own. Macros must be enabled in MS Excel Also note that Excel security settings may prevent the macros from running unless it is saved to disk first.
- XL3DRender.xls 3D Rendering Excel spreadsheet.
- Arrow.txt A 3D arrow head.
- Boxoid.txt Three intersecting cuboids.
- Crystal.txt A 3D Crystal shape.
Credits
- Christopher Allen - 3D objects, testing and debugging
- Craig Shelley - Coding
If you have any questions/queries or have created new objects that you would like to share, my contact details are listed at the bottom of the page.
Links
- http://www.gamasutra.com/view/feature/3563/microsoft_excel_revolutionary_3d_.php This is later implementation which looks almost identical, but is unrelated.
- http://developers.slashdot.org/article.pl?sid=08/03/06/1732220&from=rss The traffic from this article brought my web server down for several days - sorry.